


View K-12 Education Facts as a PDF
PUBLIC SCHOOLS
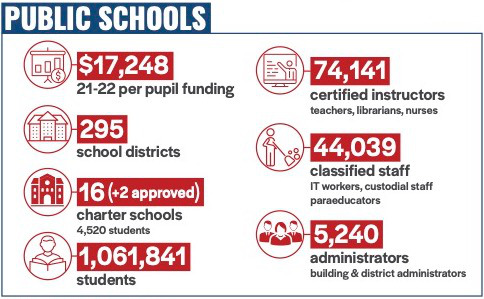
“The Washington State Constitution makes clear that it is the paramount duty of the state to make ample provision for all children within its borders, regardless of race, color, caste, or sex. The state provides funding for over one million students at 295 school districts and 16 charter schools. School districts employ over 74,000 certificated instructors (including teachers), over 44,000 classified employees, and over 5,000 administrators, making them one of the largest public employers in the state. Including state, local, and federal resources, the state spends an average of $17,428 per student.” -House Republican Caucus
ENROLLMENT
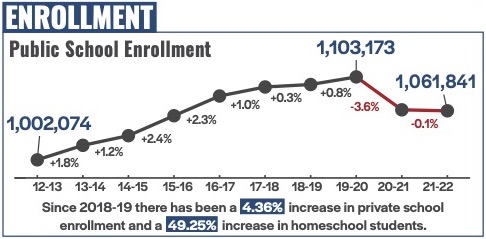
“Public school enrollment peaked in 2018-19, prior to the prolonged school closures. Since then, public school enrollment has declined by 3.7% and has yet to recover. At the same time, there has been a 4.36% increase in private school enrollment and a 49.25% increase in estimated homeschool students, suggesting that families were not satisfied with the education they were receiving.” -House Republican Caucus
FUNDING
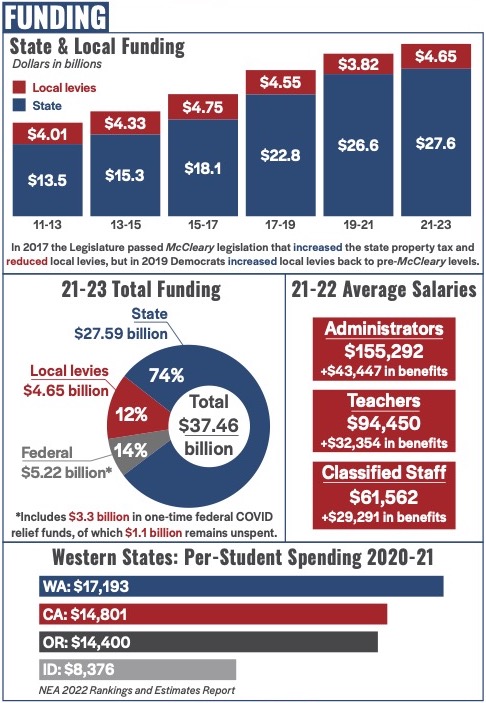
“State spending on K-12 public schools has grown significantly, more than doubling over the past decade. Funding K-12 education is primarily a state responsibility; however, taxpayers can authorize local enrichment levies to support their schools. In 2017, lawmakers reduced local school enrichment levies leading to widespread property tax savings for many taxpayers. However, in 2019, Democrats raised the local levy cap back to prior levels and have proposed bills in 2023 increasing the local levy cap even further. While local enrichment levies are a necessary component of school funding, high local levies can create unconstitutional inequities among school districts and taxpayers.
Across state, local, and federal sources, school districts received $37.46 billion in the 2021-23 operating budget. This equates to average total per student spending of $17,428, which puts Washington at the top of its peers in terms of state spending. The majority of K-12 spending goes toward staff salaries for teachers, administrators, and classified employees. While the state provides a competitive market rate salary allocation, actual salaries are determined through collective bargaining agreements between labor unions and school districts. For the 2021-22 school year, the average administrator made $198,739 in salary and benefits, the average teacher made $126,804 in salary and benefits, and the average classified employee made $90,853 in salary and benefits.” -House Republican Caucus
NATIONAL RANKINGS
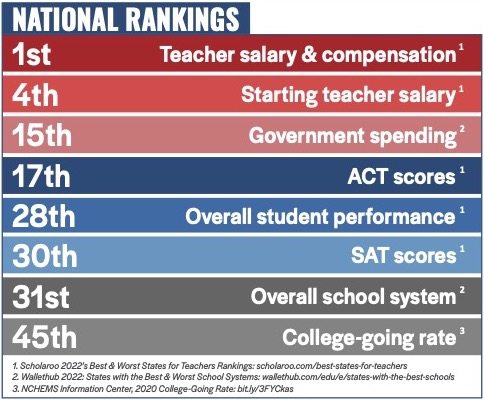
“In 2022, Scholaroo released its ranking for best and worst states for teachers across five factors – career accessibility, salary and compensation, work benefits, work environment, and student performance. Washington ranked as the overall #1 best state for teachers, in large part due to its high salary and compensation ranking. Scholaroo also noted the state performed average or below average in a number of student performance categories including ACT scores, SAT scores, and overall student performance. In 2022, Wallethub released its ranking of the states with the best and worst school systems. While Washington ranked 15th in government spending, it only ranked 31st in overall school system, leading to a designation as a high-spending state with weak schools. Based on Wallethub’s ranking, Washington public schools rank behind Nebraska (9th), Utah (13th), Florida (14th), Wyoming (20th), Kentucky (21st), and Montana (25th). Despite offering the most generous financial aid available in the country, Washington ranks 45th for students attending college within one year of graduating high school.” -House Republican Caucus
PERFORMANCE
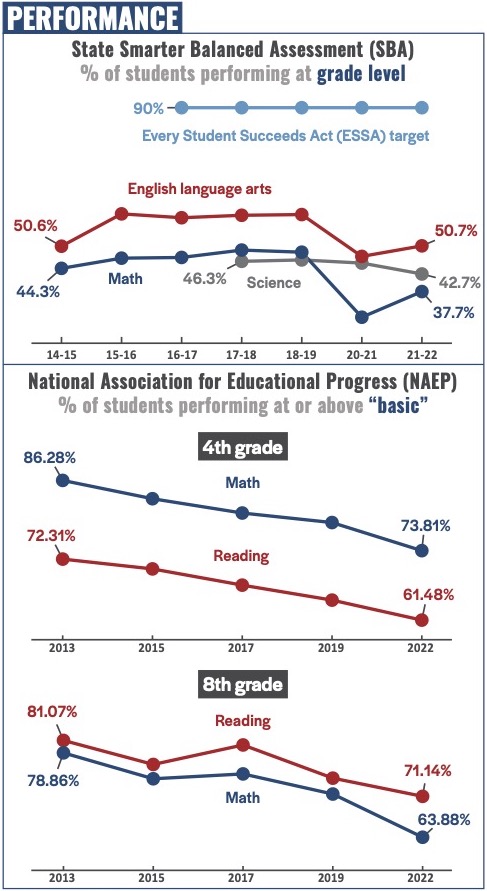
“While the Legislature has spent years increasing funding to public schools, too many students have been left behind. Student performance on national test scores has been trending down over the last decade and, after extensive school closures, state test scores are at their lowest since the state assessment began. Over 62% of Washington students do not meet grade level standards in math and about half do not meet grade level standards in English language arts. Moreover, the effects of the school closures disproportionately impacted students with the most need, widening preexisting opportunity and achievement gaps, and hitting historically disadvantaged students hardest.
The percentage of students not meeting grade level math and English language arts is especially concerning for students of color. While Asian and White students outperform their peers across all test categories, less than 35% of Black and Hispanic students are passing English language arts and less than 21% are passing math. Native Hawaiian, American Indian and Alaskan Native students are at an even greater disadvantage with about 25% passing English language arts and less than 15% passing math. Only 23% of homeless students are passing English language arts and less than 13% are passing math. Low-income students also fare worse than their higher-income peers, with only 34% passing English language arts and 21% passing math.
While Washington students ranked in the top 10 a decade ago in both math and reading performance on national assessments, they now rank 27th in fourth grade math, 19th in fourth grade reading, 17th in eight grade math, and tied for 10th in eight grade reading. While Washington test scores are on the decline, they are increasing rapidly in other states. In 2013, Washington students outperformed Idaho students in all four test categories, but now Idaho students outperform Washington students in all categories except fourth grade reading. Ten years ago, Mississippi was 49th in the country in fourth grade reading, now Mississippi students outrank Washington.” -House Republican Caucus
LEGISLATIVE REPUBLICAN SOLUTIONS
Senate and House Republicans have prioritized funding for learning loss and special education, with accountability and performance metrics. Additionally, we support parental rights and school choice, as parents know what is best for their child’s education.